Benefits
1. Calmar Ratio
2. Account & Term
3. Robot Trading
4. Transparency
5. Low brokerage fees
6. Winning trade quota of >80% & profit factor > 2
7. Competence
AD 1. CALMAR RATIO
One of our unique selling points or USP (Unique Selling Point) is the Calmar Ratio, which is an extremely important key figure. It corresponds to the quotient of the cumulative annual return and the maximum drawdown of the observation period. The higher the better. The maximum drawdown or maximum loss in value is a risk indicator that indicates the greatest loss in value of the portfolio within a period under consideration. It’s important to understand that a drawdown is not necessarily a realized loss. At least as long as the position was not closed at a loss.
The FCT Robo Trading trading system consists of several individual systems. But they all have in common that a 123 formation is required to get started. That means: 1st trend line break, 2nd candle formation and 3rd indicator must be on the right side. Entry is only possible if these conditions are met. The systems differ in that there are different approaches before activating a trigger and looking for a 123. So there is always the possibility that some system has an entry point. However, the biggest advantage of our systems is that they work semi or fully automatically. The systems were all programmed by ourselves according to our needs. The trade only has to activate the systems and the rest is done by the computer. This has the advantage that trading can take place 24/5 and there are no errors when entering. Our motto, which is also our goal, is as follows: A continuous, stable and as predictable yield curve as possible. A wonderful goal, which is rarely achieved in the industry. We’ve worked towards this goal for years, with numerous setbacks, but these are part and parcel of developing such a trading system.
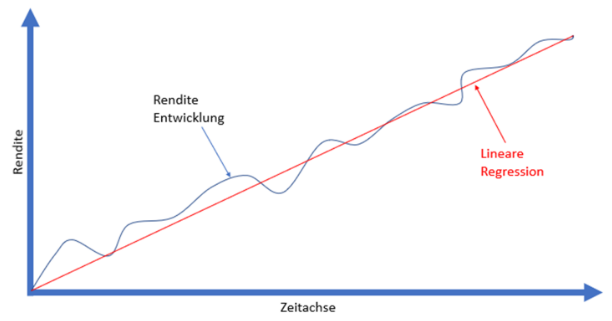
The closer the blue Equity Growth curve is to the straight line (= linear regression), the better. We try to avoid large drawdowns at all costs. Draw downs can also be measured, among other things, by the planned annual return. We don’t want a system that e.g. Brings 18% annual return, but a drawdown of 75% of the planned annual return must be expected at any time. We consider such a system to be unacceptable. In other words: it is far from compatible with everyday life. We compare ourselves to over 585 funds globally in similar asset classes. Funds were filtered out that had a Calmar ratio of more than 1 in the last 12 months. 7 funds remain.
Here is a list of multi-asset funds that we found during an internet search that have a Calmar Ratio of 1.01 to 1.33.
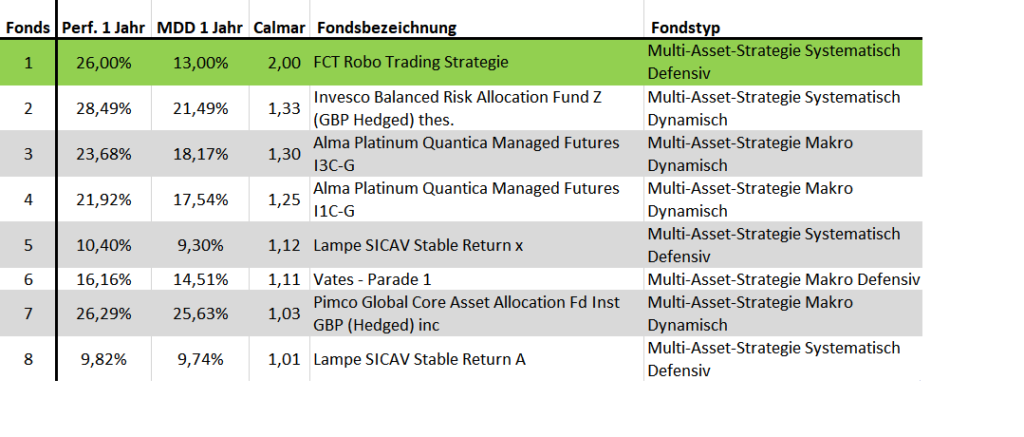
We repeat the most important finding again: out of 585 funds, only 7 funds managed to achieve a Calmar Ratio of over 1. The best fund “Invesco Balanced Risk Allocation Fund Z” achieved a Calmar ratio of 1.33. Our Calmar Ratio is 2 or higher!
AD 2. ACCOUNT & TERM
One of the big advantages of our copy trading is that your money is held in an IC Markets escrow account with a bank regulated by the Financial Markets Authority, including NAB Bank (National Australian Bank). The IC Markets account is in their own name. And the money is always available. You can always stop copying and have the money transferred back to your bank.
From a legal point of view, the customer acts independently and is 100% responsible for his account. He can stop copying at any time and have his money transferred back to his house bank. The customer is therefore NOT bound to any term. We still recommend active participation in copy trading for at least 6-12 months.
AD 3. ROBOT TRADING
The advantages of robot trading are that they work 24 hours a day, 5 days a week for us
a. identify the trigger
b. from which they then look for the “123 Entry”
c. then execute the order execution and
d. All this at the desired price including Profit Target and Stop Loss and
e. once activated, the robot is extremely inexpensive and
f. Last but not least, all without error input
AD 4. TRANSPARENCY
We have set ourselves the goal of setting new standards in terms of transparency and communication.
- We have linked our master account at ICMarkets with the external auditor www.myfxbook.com so that the return calculation is updated several times a day.
- We have linked all our trading signals to Telegram.
- Not only do we provide a market report at the beginning of each month on our homepage or in our Telegram group, but we also produce a video in which we, as the manager of the master account, talk about the past month. These videos also discuss the latest developments and plans for the short and medium term.
- At the beginning of the month we have 1-2 zoom calls for questions and answers for our Telegram community.
- Existing and prospective customers can hold a 1:1 Zoom meeting with the manager of the master account upon request.
AD 5. LOW BROKERAGE FEES
Due to our high copy capital > USD 1 million, we enjoy extremely low fees with broker IC Markets, which are on average 75% lower than comparable brokers. In other words, based on our annual trading volume, we typically have around 6% costs for our trading activities. At IC Markets we only have 1.5% costs, so the client has an annual return of around 4.5% higher with the same trading volume.
AD 6. WINNING TRADE RATIO OF >80% & PROFIT FACTOR > 2
We have developed a unique and highly complex position opening module which is a combination of
a.) 123 entry module and
b.) Fibonacci retracement and
c). channel trading
This enables us to have a winning trade quote (= WTQ) of > 80% with a profit factor of >2.
ad a.) 123 entry module
123 Entry means:
1, we look for at least three falling or rising bars, and draw a trend line
2, we are looking for a break of the trendline of the following bar
3, the RSI/STO indicator must be below 25 or above 75 on the right side.
We have other entry conditions, but we won’t go into them here. There are several ways to draw a trend line. Each trend line was programmed individually in cTrader with C#. A linear equation is used to calculate the trend line. This straight line runs through the high of the first falling bar and through the close of one of the next bars. Depending on whether the closes of all bars are below the trend line. The formula for the linear equation is: f(x) = m * x + b. The b describes the y-intercept. So this is the point where the linear function intersects the y-axis. In our case, the b is the high of the first falling bar. The slope is in m. This explains how flat or steep a function is. When the m is positive the function is increasing (an up trendline) and when the m is negative it is decreasing (down trendline).
ad b.) Fibonacci retracement
We use the Fibonacci system as an additive tool to predict future movement. From our point of view, the system used singly is not effective enough. However, in combination with other tools, it is an indispensable forecasting aid. We therefore use it as part of a broader analysis rather than as the sole indicator.
ad c.) Channel trading
Here we refer to the book by Richard Lehman, who wrote the book Far from Random. Its findings are partially used in our trading.
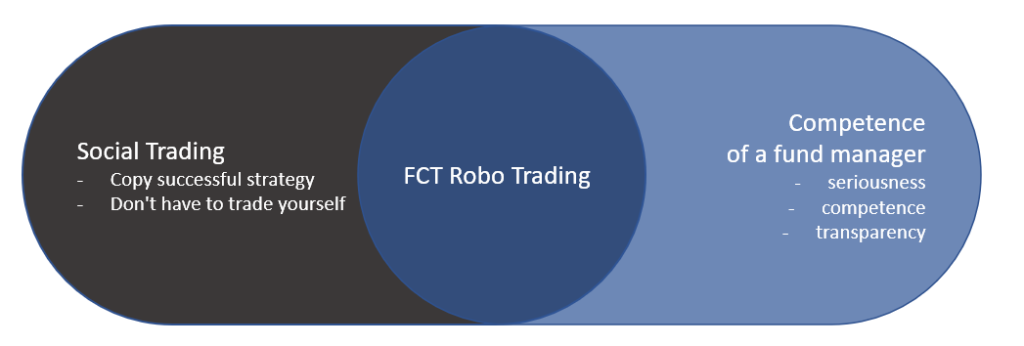
AD 7 COMPETENCE
With our innovative approach, we combine social trading with the professionalism of a fund manager. Please note, however, that we are not fund managers!